
How Temperature Variation Affects the Velocity of Sound Waves
By Clay, Ruby, and Alden
In this experiment my group was trying to figure out if temperature will affect the speed that sound a sound wave is traveling. We decided to do this topic because it would be a fun challenging experiment but with an easy approach to it. We thought that if the temperature was higher that the sound waves would travel faster than if it was a lower temperature outside.
Our question asks if and how temperature affects the speed of sound. This topic could be very important for future recognition and use in other tests. We chose to study the effect of temperature on the speed of sound because this would help future projects to be more consistent. If we were to do a project in which we were testing speed of sound, the information we learned in this project would be helpful to avoid errors. For example, if we did not know that the temperature of the medium affects the speed of the waves, we might end up with skewed data because of a temperature drop or rise. This project was also helpful because it taught us how to measure the speed of sound. If we need these skills again, we will refine the method to reduce errors that have come up. To do this, you will need two people, two phones, a computer with a beeping noise, a thermometer, and a timer. With one person standing at each end of a long distance, have the timer raise their hand to signal the start for the computer person. The person with the computer will then play the beep with the timer timing. The timer will stop the stopwatch when they hear the noise. After doing this test four times on three different days, we found out that the hotter the temperature, the faster the waves travel.
In order to do this experiment we needed at least 2 people but we had three to make things easier. The very first thing we would do is take the temperature outside with a thermocouple (a very precise thermometer) to measure the temperature outside in degrees celsius. We had one person positioned with a computer and a cell phone 256 meters away from two other people. The two people that were together had a timer and a cellphone that was calling the person 256 meters away from them. The person on there computer would pull up a loud beep on youtube. Both people with phones would have their phones on speaker phone. then the person with the phone that did not have the computer would raise their hand three times and on the third time the timer would start the timer and the computer person would play the sound on their computer into their phone. Once the timer heard the sound he would stop the timer and tell the person with the computer what the time was so that they could record it down.
The question asked by our group was, “How do varying temperatures affect the velocity of a sound wave?” The hypothesis that we developed is that, “If the air is a warmer temperature, the waves will travel at a slightly higher velocity due to the hot air particles moving more rapidly than cold.”
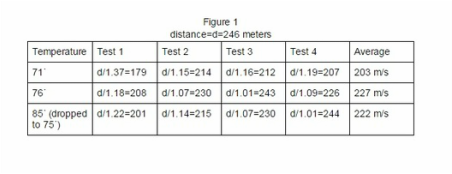
In accordance to our data, it seems as though our hypothesis was correct. On our first day of testing, the temperature was cool, causing a slower speed(Figure 2). On our last day of testing, the temperature ended a little cooler than the second day (Figure 1), causing the velocity to drop as well. Had the temperature either remained constant or increased, however, we would have recorded a higher velocity than the previous set of data, thus, proving our hypothesis to be correct.
In this testing process, we used calculations of the speed of sound in order to find out how temperature affects sound. We expected that the sound would travel more quickly in warmer temperatures. This could be useful information in the “real world” in a few instances. At a concert, it could be cold and there might actually be a delay in the time it takes for the sound to reach you. This is shown in our data. We took three different days of data, four times each day. On the coldest day, at 71˙, the speed of the sound was slowest, as we predicted. The second day was the warmest, and the speed of the sound was faster because molecules vibrate faster to produce the heat. This confirms what we expected, although the results were not as clear as they could have been. The independent variable, temperature, had a measurable effect on the dependent variable, sound speed, because we saw that when temperatures rose, so did the speeds. The results were not completely clear because our independent variable could be quickly and uncontrollably changed. Also, each day the temperatures were not very different from each other, which didn’t give us much of a range. Over the three days, the average was 217 meters per second, however the speed of sound (at sea level) is 340 meters per second, giving us an error 123 meters per second, or a percent error of 57%. That is a very large error margin, and there are many variables that could have made this error. The main variable is the reaction time of each person: the one timing and the one playing the sound. Because the video takes a few milliseconds to play, plus the time it takes me to play the video, this creates additional time that adds to the error. Furthermore, this same delay occurs with the person timing. It takes them time to press the button to start the timer. So, it is pretty difficult to have the timer and the beep start at the same time, especially with the small scale and fractions of seconds that we are working with. This data would be important if we had a less error-laden method of timing. In order to improve upon these errors to weed them out, we could have had two people timing: one at the end, stopping the timer when they hear the beep, and the other being the person playing the beep, stopping the timer when the person at the other end raises their hand. We could then take the average of these times. A further experiment with this other technique would be to try to compare more extreme temperatures. Overall, this experiment, although flawed, showed correct results.
Our question asks if and how temperature affects the speed of sound. This topic could be very important for future recognition and use in other tests. We chose to study the effect of temperature on the speed of sound because this would help future projects to be more consistent. If we were to do a project in which we were testing speed of sound, the information we learned in this project would be helpful to avoid errors. For example, if we did not know that the temperature of the medium affects the speed of the waves, we might end up with skewed data because of a temperature drop or rise. This project was also helpful because it taught us how to measure the speed of sound. If we need these skills again, we will refine the method to reduce errors that have come up. To do this, you will need two people, two phones, a computer with a beeping noise, a thermometer, and a timer. With one person standing at each end of a long distance, have the timer raise their hand to signal the start for the computer person. The person with the computer will then play the beep with the timer timing. The timer will stop the stopwatch when they hear the noise. After doing this test four times on three different days, we found out that the hotter the temperature, the faster the waves travel.
In order to do this experiment we needed at least 2 people but we had three to make things easier. The very first thing we would do is take the temperature outside with a thermocouple (a very precise thermometer) to measure the temperature outside in degrees celsius. We had one person positioned with a computer and a cell phone 256 meters away from two other people. The two people that were together had a timer and a cellphone that was calling the person 256 meters away from them. The person on there computer would pull up a loud beep on youtube. Both people with phones would have their phones on speaker phone. then the person with the phone that did not have the computer would raise their hand three times and on the third time the timer would start the timer and the computer person would play the sound on their computer into their phone. Once the timer heard the sound he would stop the timer and tell the person with the computer what the time was so that they could record it down.
The question asked by our group was, “How do varying temperatures affect the velocity of a sound wave?” The hypothesis that we developed is that, “If the air is a warmer temperature, the waves will travel at a slightly higher velocity due to the hot air particles moving more rapidly than cold.”
In accordance to our data, it seems as though our hypothesis was correct. On our first day of testing, the temperature was cool, causing a slower speed(Figure 2). On our last day of testing, the temperature ended a little cooler than the second day (Figure 1), causing the velocity to drop as well. Had the temperature either remained constant or increased, however, we would have recorded a higher velocity than the previous set of data, thus, proving our hypothesis to be correct.
In this testing process, we used calculations of the speed of sound in order to find out how temperature affects sound. We expected that the sound would travel more quickly in warmer temperatures. This could be useful information in the “real world” in a few instances. At a concert, it could be cold and there might actually be a delay in the time it takes for the sound to reach you. This is shown in our data. We took three different days of data, four times each day. On the coldest day, at 71˙, the speed of the sound was slowest, as we predicted. The second day was the warmest, and the speed of the sound was faster because molecules vibrate faster to produce the heat. This confirms what we expected, although the results were not as clear as they could have been. The independent variable, temperature, had a measurable effect on the dependent variable, sound speed, because we saw that when temperatures rose, so did the speeds. The results were not completely clear because our independent variable could be quickly and uncontrollably changed. Also, each day the temperatures were not very different from each other, which didn’t give us much of a range. Over the three days, the average was 217 meters per second, however the speed of sound (at sea level) is 340 meters per second, giving us an error 123 meters per second, or a percent error of 57%. That is a very large error margin, and there are many variables that could have made this error. The main variable is the reaction time of each person: the one timing and the one playing the sound. Because the video takes a few milliseconds to play, plus the time it takes me to play the video, this creates additional time that adds to the error. Furthermore, this same delay occurs with the person timing. It takes them time to press the button to start the timer. So, it is pretty difficult to have the timer and the beep start at the same time, especially with the small scale and fractions of seconds that we are working with. This data would be important if we had a less error-laden method of timing. In order to improve upon these errors to weed them out, we could have had two people timing: one at the end, stopping the timer when they hear the beep, and the other being the person playing the beep, stopping the timer when the person at the other end raises their hand. We could then take the average of these times. A further experiment with this other technique would be to try to compare more extreme temperatures. Overall, this experiment, although flawed, showed correct results.
Design
|
|
|
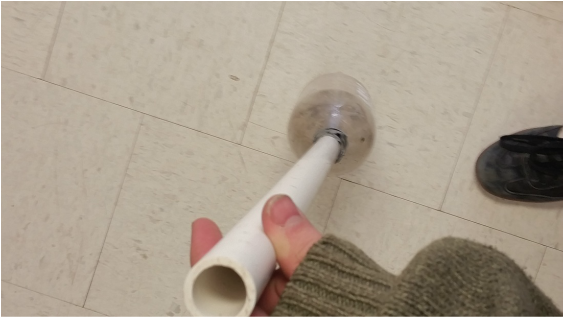
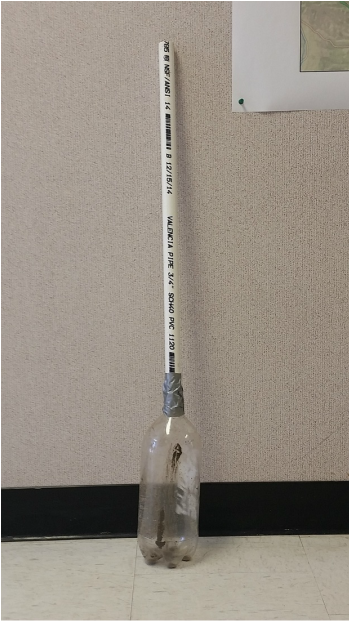
For this project we had where given a area and had to build a affordable and easy to use water filter to help the people in this area get clean and safe to drink water. For my group this was no easy task. we got nova Scotia Canada ( a link is at the bottom of this paragraph to a area description that my group and I made about Nova Scotia), a place that you would think has good water but actually has many problems. The biggest problems where there was a large amount of metal and Micro organisms in the water. We had to build a filter that could filter all of this out. what we came up with was a filter that is just a pvc pipe attached to bottle. inside the pipe is goz, charcoal, and sand to filter the water as it trickles down the pipe. Over all this project was a real challenge and a fun way to possibly make a difference somewhere else beside durango co.
(https://docs.google.com/a/animashighschool.com/document/d/1S2Qeg7ajZY2G31ewNVIK5AHn2wWyYPca9q-vLuLfCgQ/edit) |
Snow science prodject
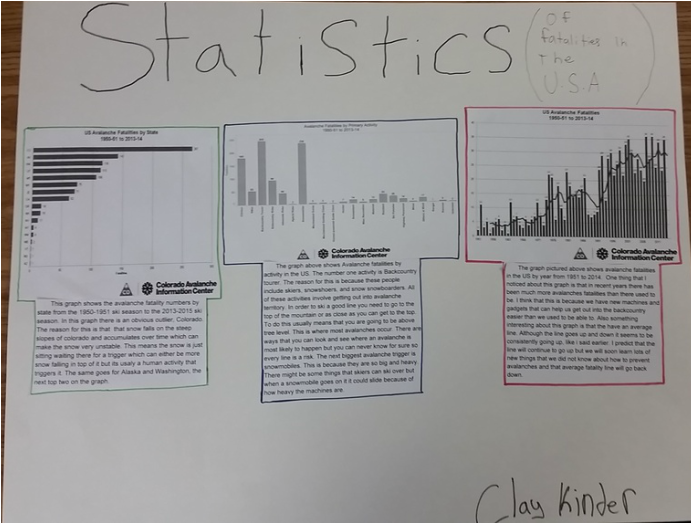
Learning about snow science in class has been very beneficial to my life. I love the winter and love to get outside when it snows. I like to ski and sometimes ride snowmobiles. If i want to be doing this safely I will need to know about avalanches. This snow science unit has taught me a lot about how to spot potential avalanche areas and what do do if one happens. I also Learned a bunch of new things about the snow and water in the southwest. One thing that I did not know before is that the colorado runs extremely low on water by the time it gets to Mexico, the river used to flow al the way down to Mexico but because we have started to take water out of it it is almost all gone by the time it gets down there. The colorado river is where most southwest places get there water from, so there really is no easy solution for this problem. One skill that I acquired during this unit was how to look through information and see if it is legit or not, and also how to read data and tell if it is reliable. Before i found the information that I have posted above I had to look through many other web cites and look at all of there data. In the end I picked the Data above from http://avalanche.state.co.us/accidents/statistics-an because it was by far the most reliable source. It was a government funded organization and my teacher had recommended it to me.
My poster is showing the statistics of avalanche fatalities. There are three different graphs on my poster. The first one is showing avalanche fatalities by state. The second one shows avalanche fatalities by Activity. And the third one shows avalanche fatality by year and also has a average line. This topic that i chose fits the snow science unit perfectly because it is all about statistics about avalanches and avalanches is what we have been learning about in class.
My poster is showing the statistics of avalanche fatalities. There are three different graphs on my poster. The first one is showing avalanche fatalities by state. The second one shows avalanche fatalities by Activity. And the third one shows avalanche fatality by year and also has a average line. This topic that i chose fits the snow science unit perfectly because it is all about statistics about avalanches and avalanches is what we have been learning about in class.
YOLO PROJECT
Skiing Park vs Skiing normal
ARTICLES ABOUT PARK SKI INJURIES
Article about Kevin pierce and his head injuries
http://www.usatoday.com/story/sports/olympics/2013/02/25/snowboarders-skiers-kevin-pearce-concern-concussions/1947593/
skiing article claiming that if you ski park you're more likely to get a head injury
http://www.bostonglobe.com/metro/regionals/west/2012/12/13/concussion-education-spreading-among-skiers-and-snowboarders-helmets-rise-ski-areas-ski-areas-move-cut-head-injury/MXTMjXpjBh3FBD7SbAL4NJ/story.html
TWO VIDEOS WITH VISUAL EVIDENCE ABOUT PARK SKIING INJURIES.
Kevin Pierce Double cork Half pipe major head trauma (Full movie is the crash real)
https://www.youtube.com/watch?v=Rz_ruH2EDXw
Mostly park little bit of free skiing crashes (cation if you're squeamish or do not like to see people getting injured i advise you not to for this video is very graphic)
https://www.youtube.com/watch?v=Q-dVQGZVi80

Summery
Clay, Ruby, Jocelyn, Will
Jocelyn:
1 Description of rockets include justification of your design 3-5 each rocket
4 State question answerable and measurable 1-2
2 Pictures of test1-
5 Hypothesis written properly
clay 6,11,12,13,14
ruby 3,7, 8,9,10
Fins
All were the same size and shape.
Pressure
25 PSI (Leaky’s max.)
Amount of water
350 mL
Weight
Around 132 grams each
Litre size
2 liters
Indpt. Variable (Diameter)
Angle of Elevation
Distance From Launcher
Hang Time
Height
R1/T1
11 cm
55˙
10 Meters
n/a
14.3 m
R2/T1
6.6 cm
54˙
10 Meters
n/a
13.8 m
R1/T2
11 cm
42˙
19 Meters
n/a
17.1 m
R2/T2
6.6 cm
32˙
19 Meters
n/a
11.9 m
R1/T3
11 cm
61˙
10 Meters
n/a
18.0 m
R2/T3
6.6 cm
53˙
10 Meters
n/a
13.3 m
Clay, Ruby, Jocelyn, Will
Jocelyn:
1 Description of rockets include justification of your design 3-5 each rocket
4 State question answerable and measurable 1-2
2 Pictures of test1-
5 Hypothesis written properly
clay 6,11,12,13,14
ruby 3,7, 8,9,10
- Leaky- our first rocket was a 2 liter smart water bottles rocket. This rocket did leak quite a bit. The rocket still shot though and pretty far for only going to 25psi. The bottle had a crooked side to it that we balanced out by making one of the sides heavier.The cone fit the rocket well with a cut folder inside and paperboard. The fins on both rockets were the same size. Whale- was the single two liter bottle with the same material for the nose cone and fins, just fit to the rockets size.
- (Pictures above)
- We chose our variable, diameter, for a few reasons. First of all, we wanted something that would be a bit more of a challenge to control. We also wanted something that would have to include at least two rockets. For these reasons, we chose to use diameter as our variable.
- Our question was does size affect height of rocket. we could easily measure the height of our rocket by creating two different rockets but the same diameter.
- Our hypothesis was written correctly because it was an if then because statement. Also it had all of the criteria it needed.
- When testing our variable (diameter) we had to keep everything the same except for the diameter. We would launch the rockets and record the height. We did this very many times so we could get very accurate data. We had rube stand 10 meters away from the launch module and measure the rocket at its peak.
Fins
All were the same size and shape.
Pressure
25 PSI (Leaky’s max.)
Amount of water
350 mL
Weight
Around 132 grams each
Litre size
2 liters
- The one variable that we tried to keep constant but couldn’t was nose cone size. This was hard because one size would be too big for the other rocket, and the other would be too small. In the end, we just fitted the cone to each rocket individually rather than having the same sized cone. However, we could have found a middle size.
-
Indpt. Variable (Diameter)
Angle of Elevation
Distance From Launcher
Hang Time
Height
R1/T1
11 cm
55˙
10 Meters
n/a
14.3 m
R2/T1
6.6 cm
54˙
10 Meters
n/a
13.8 m
R1/T2
11 cm
42˙
19 Meters
n/a
17.1 m
R2/T2
6.6 cm
32˙
19 Meters
n/a
11.9 m
R1/T3
11 cm
61˙
10 Meters
n/a
18.0 m
R2/T3
6.6 cm
53˙
10 Meters
n/a
13.3 m
- We collected our data by finding the height. We did multiple tests to get consistent results.
- (See graph below)
- (See graph below)
- (See graph below)
- (See graph below)
Description of rockets: "Leaky"- Our first rocket was a 2 liter smart water bottles rocket. This rocket did leak quite a bit. The rocket still shot though and pretty far for only going to 25psi. The bottle had a crooked side to it that we balanced out by making one of the sides heavier.The cone fit the rocket well with a cut folder inside and paperboard. The fins on both rockets were the same size. Whale- was the single two liter bottle with the same material for the nose cone and fins, just fit to the rockets size.
Why we chose our variable: We chose our variable, diameter, for a few reasons. First of all, we wanted something that would be a bit more of a challenge to control. We also wanted something that would have to include at least two rockets. For these reasons, we chose to use diameter as our variable.
Our question: Our question was "Does diameter affect the height of the rocket?". We could easily measure the height of our rocket by creating two different rockets with two different diameters and the same volume.
Our hypothesis: Our hypothesis was written correctly because it was an if then because statement. Also it had all of the criteria it needed. Our hypothesis stated: if diameter affects height, then a smaller diameter will go higher because it is more aerodynamic.
How we tested our variable: When testing our variable (diameter) we had to keep everything the same except for the diameter. We would launch the rockets and record the height. We did this very many times so we could get very accurate data. We had Ruby stand 10 meters away from the launch module and measure angle of the rocket at its peak.
Variables We Kept Constant:
Fins- All were the same size and shape.
Pressure- 25 PSI (Leaky’s max.)
Amount of water- 350 mL
Weight (mass)- Around 132 grams each
Liter size- 2 liters
One variable we couldn't keep constant: The one variable that we tried to keep constant but couldn’t was nose cone size. This was hard because one size would be too big for the other rocket, and the other would be too small. In the end, we just fitted the cone to each rocket individually rather than having the same sized cone. However, we could have found a middle size.
How we collected our data: We collected our data by finding the height. To do this, we used tangent. (See below). We did multiple tests to get accurate results.
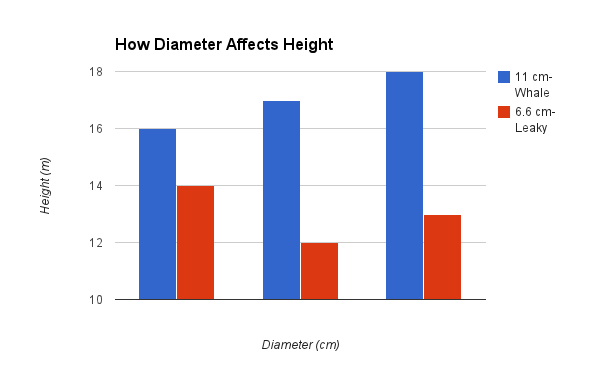
How we graphed our data: We graphed our data using google spreadsheets. We decided to use a bar graph because it gives a visual representation of how our diameter affected our height.
Conclusion: In conclusion, we found our hypothesis to be incorrect. Our hypothesis states that if diameter affects height, then a smaller diameter will go higher because it is more aerodynamic. This was incorrect because in order to keep our volume constant, we had to merge two bottles together. This caused a leak in our rocket. Also, it was bent towards one side. This created a flaw in our testing. Furthermore, we needed another point on our graph. Our last rocket that was built wasn’t able to get off the launch pad because of a major leak. For the most part we had a very successful study between the different sized rockets. The leak in our rocket was very difficult for us. Furthermore, we needed at least 3 sets of data, so we took on an additional group member. However, one of our rockets ended up not working so we only had two sets of data. To compensate for this, we did three tests per rocket to achieve more than two data sets. Our recommendation for other students building rockets is to never give up. Our teacher told us a few times that our rocket would not fly because it leaked, however it still flew higher than others. You need to be able to persevere when it gets hard because it is all worth it in the end.
Conclusion-
In conclusion, we found our hypothesis to be incorrect. Our hypothesis states that if diameter affects height, then a smaller diameter will go higher because it is more aerodynamic.
This was incorrect because in order to keep our volume constant, we had to merge two bottles together. This caused a leak in our rocket. Also, it was bent towards one side. This created a flaw in our testing. Furthermore, we needed another point on own graph. Our last rocket that was built wasn’t able to get off the launch pad because of a major leak. For the most part we had a very successful study between the different sized rockets.
Why we chose our variable: We chose our variable, diameter, for a few reasons. First of all, we wanted something that would be a bit more of a challenge to control. We also wanted something that would have to include at least two rockets. For these reasons, we chose to use diameter as our variable.
Our question: Our question was "Does diameter affect the height of the rocket?". We could easily measure the height of our rocket by creating two different rockets with two different diameters and the same volume.
Our hypothesis: Our hypothesis was written correctly because it was an if then because statement. Also it had all of the criteria it needed. Our hypothesis stated: if diameter affects height, then a smaller diameter will go higher because it is more aerodynamic.
How we tested our variable: When testing our variable (diameter) we had to keep everything the same except for the diameter. We would launch the rockets and record the height. We did this very many times so we could get very accurate data. We had Ruby stand 10 meters away from the launch module and measure angle of the rocket at its peak.
Variables We Kept Constant:
Fins- All were the same size and shape.
Pressure- 25 PSI (Leaky’s max.)
Amount of water- 350 mL
Weight (mass)- Around 132 grams each
Liter size- 2 liters
One variable we couldn't keep constant: The one variable that we tried to keep constant but couldn’t was nose cone size. This was hard because one size would be too big for the other rocket, and the other would be too small. In the end, we just fitted the cone to each rocket individually rather than having the same sized cone. However, we could have found a middle size.
How we collected our data: We collected our data by finding the height. To do this, we used tangent. (See below). We did multiple tests to get accurate results.
How we graphed our data: We graphed our data using google spreadsheets. We decided to use a bar graph because it gives a visual representation of how our diameter affected our height.
Conclusion: In conclusion, we found our hypothesis to be incorrect. Our hypothesis states that if diameter affects height, then a smaller diameter will go higher because it is more aerodynamic. This was incorrect because in order to keep our volume constant, we had to merge two bottles together. This caused a leak in our rocket. Also, it was bent towards one side. This created a flaw in our testing. Furthermore, we needed another point on our graph. Our last rocket that was built wasn’t able to get off the launch pad because of a major leak. For the most part we had a very successful study between the different sized rockets. The leak in our rocket was very difficult for us. Furthermore, we needed at least 3 sets of data, so we took on an additional group member. However, one of our rockets ended up not working so we only had two sets of data. To compensate for this, we did three tests per rocket to achieve more than two data sets. Our recommendation for other students building rockets is to never give up. Our teacher told us a few times that our rocket would not fly because it leaked, however it still flew higher than others. You need to be able to persevere when it gets hard because it is all worth it in the end.
Conclusion-
In conclusion, we found our hypothesis to be incorrect. Our hypothesis states that if diameter affects height, then a smaller diameter will go higher because it is more aerodynamic.
This was incorrect because in order to keep our volume constant, we had to merge two bottles together. This caused a leak in our rocket. Also, it was bent towards one side. This created a flaw in our testing. Furthermore, we needed another point on own graph. Our last rocket that was built wasn’t able to get off the launch pad because of a major leak. For the most part we had a very successful study between the different sized rockets.
